
 英语
英语 俄语
俄语Content
- 1 What Bioprocess Monitoring Actually Measures
- 2 Where a Measurement Lives: Offline, At-line, Online, and In-line
- 3 Sensor Placement and Vessel Design Decide Whether the Data Is Real
- 4 From Measurement to Control: Loops, Setpoints, and Soft Sensors
- 5 Scaling Monitoring from Pilot to Production
- 6 Where Monitoring Fails: Fouling, Drift, and Contamination
- 7 Selection Checklist for Monitoring-Ready Equipment
- 8 Frequently Asked Questions About Bioprocess Monitoring
Bioprocess monitoring is the layer that catches that kind of silent drift: the probes, sampling points, analyzers, control loops, and data records that hold a fermentation or cell culture inside its validated operating window. The sections below cover what to measure, where each measurement should live, how vessel and port design decide whether the numbers can be trusted, and what to verify before buying monitoring-ready equipment.
What Bioprocess Monitoring Actually Measures
Bioprocess monitoring is the continuous or periodic measurement of the physical, chemical, and biological variables inside a bioreactor, together with the data handling that turns those readings into decisions about feeding, aeration, temperature, and harvest timing.
Measurements fall into three families, and each needs a different treatment. Physical variables such as temperature, pressure, agitation speed, and level are fast, inexpensive, and reliable. Chemical variables such as pH, dissolved oxygen, and off-gas composition are also measured in place, but they depend on probes that foul and drift. Biological variables such as biomass, residual substrate, metabolites, and product titer usually come from samples, which introduces a lag that no software can fully remove.
| Parameter | Typical band | Measurement | Control action |
| Temperature | 30 to 37 C | Pt100 in a thermowell | Jacket or coil cooling, steam or electric heating |
| pH | 6.8 to 7.2 | Glass or ISFET electrode with at-line verification | Acid and base dosing through peristaltic pumps |
| Dissolved oxygen | 20 to 50 percent of air saturation | Optical or polarographic probe | Cascade to agitation, then airflow, then oxygen enrichment |
| Off-gas O2 and CO2 | 0.5 to 5 percent CO2 in the outlet | Paramagnetic and infrared analyzers | Feed rate, metabolic state checks, carbon balance |
| Residual substrate | 0.5 to 10 g/L glucose | At-line enzymatic analyzer, online Raman, or soft sensor | Feed pump profile in fed-batch mode |
| Biomass | 1 to 100 g/L dry cell weight | Capacitance probe, optical density, or off-gas model | Feed decisions and harvest timing |
| Pressure and foam | 0.2 to 1.0 bar gauge | Pressure transmitter and conductivity foam probe | Headspace venting and antifoam dosing |
Substrate and biomass figures matter most in fed-batch and perfusion processes, where the feed decision is made every few minutes. In batch culture, the same parameters are mainly documented rather than controlled, which changes how much money a measurement point is worth.
Where a Measurement Lives: Offline, At-line, Online, and In-line
The same pH or glucose value can be produced four different ways, and the position of the measurement decides its lag time, its contamination risk, and its cost per data point.
- Offline: a sample is carried to a laboratory bench. Accuracy is high and the vessel is never at risk, but results arrive hours later.
- At-line: an analyzer or autosampler sits beside the skid, draws a sample, and does not return it to the vessel.
- Online: a continuous loop pulls liquid through a flow cell and usually returns or wastes it after measurement.
- In-line: the sensor is mounted in the vessel wall and sterilized in place with the reactor.
In-line measurement
- Reading is available continuously and can drive a control loop directly.
- No sample handling, no manual labor, no wasted broth.
- Must survive steam sterilization, CIP chemistry, and repeated pressure cycles.
- Fouling reduces accuracy quietly, and a single failed probe removes the control input.
At-line measurement
- Works for analytes with no reliable in-place sensor, such as glucose, lactate, and product titer.
- Keeps expensive analyzers outside the sterile boundary.
- Simpler to qualify, replace, and service during a campaign.
- Discrete results with a lag, plus consumables, reagents, and operator time.
Most production processes end up with a hybrid: in-line temperature, pressure, pH, and dissolved oxygen for control, plus at-line or online analyzers for substrates and products, and a soft sensor to bridge the gap between them.
Sensor Placement and Vessel Design Decide Whether the Data Is Real
Probe data is only as good as the port it sits in: immersion depth, dead zones, and the sterilization sequence decide whether a reading tracks the bulk liquid or a stagnant film on the vessel wall.
Port layout and immersion depth
Standard 25 mm ports are still the practical default, because they accept most pH, dissolved oxygen, and conductivity probes without adapters. The probe tip should sit at least 60 to 80 mm into the liquid at the minimum working volume, not only at maximum fill. Keep pH and dissolved oxygen probes out of the baffle wake and away from the immediate sparger plume, where bubble density distorts both readings. One spare capped port costs little at the design stage and saves a weld later.
Calibration and sterilization sequence
Two-point pH calibration with fresh buffers comes before steam sterilization, and dissolved oxygen gets a zero and span check in the same window; a post-sterilization offset of 0.05 to 0.1 pH units is normal, while larger drift points to a failing reference junction or membrane. Teams that follow documented calibration checks for biofermentation equipment usually catch that drift in the first batch instead of the fifth.
CIP and SIP compatibility
Wetted parts in SUS316L with a defined surface finish handle repeated clean-in-place cycles better than mixed materials, and the probe itself has temperature and chemical limits that belong in the cleaning procedure, not in a folder. Retractable housings allow a probe to be removed mid-campaign, but each seal is an additional contamination path that needs a replacement schedule.
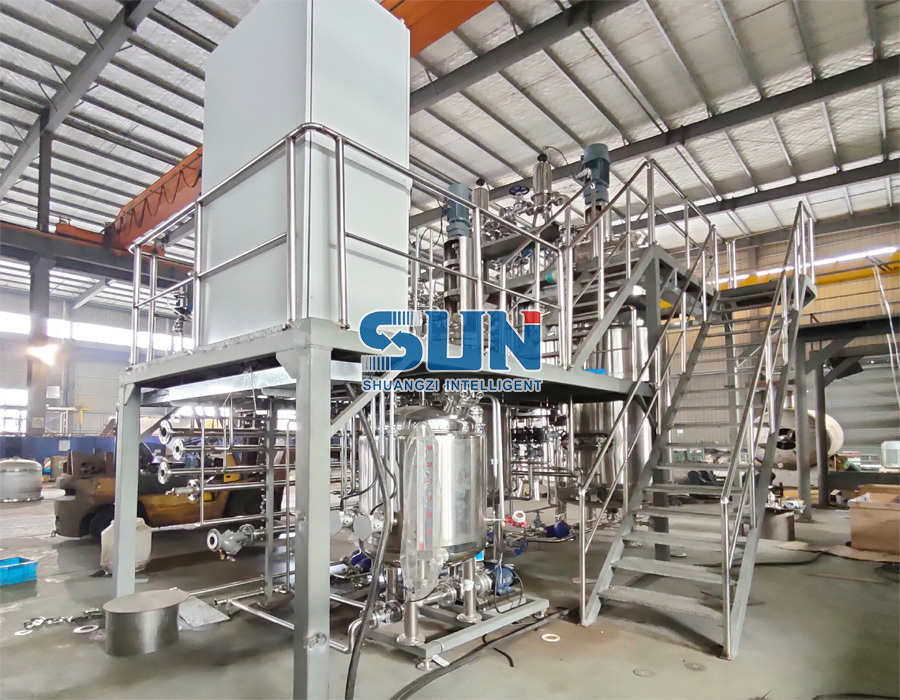 Trichoderma Fungus Fermentation System FermenterA stainless steel fermenter for Trichoderma fermentation, relevant when CIP, probe limits, and control-loop response determine reliable operation.View Product →
From Measurement to Control: Loops, Setpoints, and Soft Sensors
Control is what separates monitoring from data collection: a measurement earns its place in the loop only when something changes as soon as the value leaves its band.
A feedback loop has three moving parts. The controller compares a reading with its setpoint, applies proportional, integral, and derivative terms, and drives an actuator such as a pump, valve, or motor drive. Dissolved oxygen is normally handled as a cascade: agitation speed rises first, airflow follows, and oxygen enrichment is the last resort because it is the most expensive. pH uses acid and base pumps with a deadband wide enough to prevent short cycling, since a peristaltic pump that reverses every few seconds will fail within weeks.
Soft sensors fill the gaps between hardware measurements. A partial least squares model built from cumulative base addition, off-gas CO2, oxygen uptake rate, and Raman spectra can estimate glucose, biomass, and product in real time without another port in the vessel. The trade-off is validation: at least 15 to 20 reference samples spread across the expected range, plus a re-check whenever raw materials or the scale changes.
Scaling Monitoring from Pilot to Production
The scale-up plan should be written at the same time as the monitoring plan, because a sensor set that fits a 10 L glass reactor rarely transfers directly to a 2,000 L stainless vessel.
- Fix the scale-up criteria before the first run: volumetric mass transfer coefficient, power input per volume, tip speed, and mixing time.
- Instrument the pilot vessel exactly like the production vessel, using the same probe models, port positions, and control logic.
- Run at least three verification batches and log every variable, including the ones that nothing controls yet.
- Compare at-line results with in-line trends until a transferable model exists, instead of copying setpoints across scales.
- Repeat the critical calibration checks after every sterilization cycle and record the offsets in the batch file.
Pilot skids in the 10 to 200 L range are where this discipline is cheapest to build. Documenting the sensor map against a completed biofermentation project before technology transfer is the fastest way to find a probe configuration that cannot be replicated at production scale, while the fix is still a drawing change rather than a re-weld.
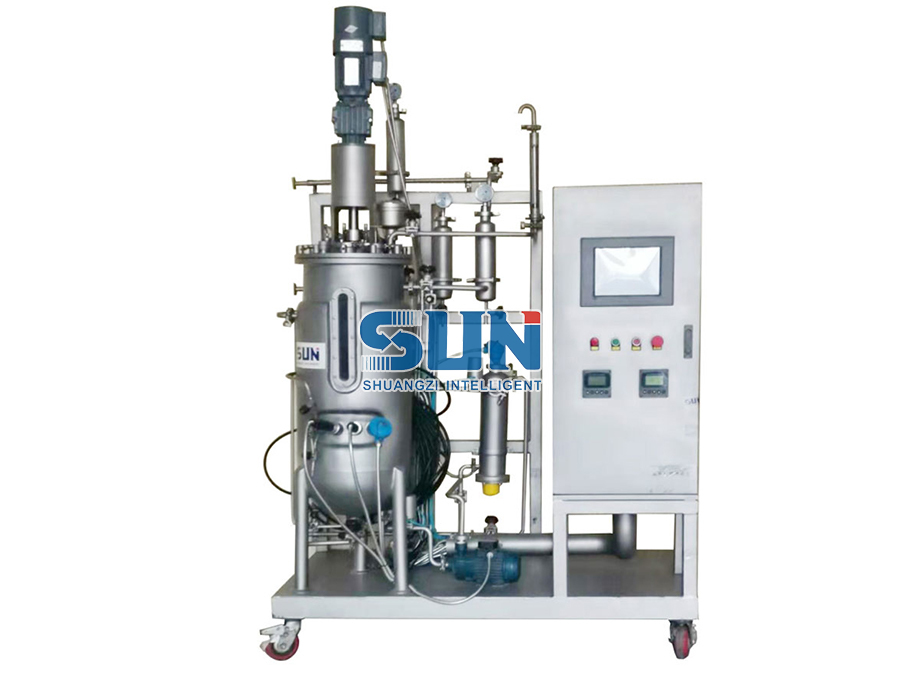 Pilot Scale Mechanical Agitated Stainless Steel Fermenter for Microbial CulturePilot-scale stainless steel fermenter with touchscreen control and sensor mapping, suited for early process validation before monitoring fouling and contamination risks scale up.View Product →
Where Monitoring Fails: Fouling, Drift, and Contamination
Most monitoring failures are mechanical or microbial long before they are mathematical, and fouling, drift, and contamination account for the majority of lost control loops in a typical campaign.
| Failure mode | Symptom | Countermeasure |
| Reference junction clogging | pH drifts upward over 10 to 20 hours and calibration offsets grow | Match the electrode to the medium and schedule a mid-campaign verification |
| Membrane fouling | Dissolved oxygen reading lags behind agitation changes | Keep a spare port and use optical sensors where cleaning access is limited |
| Foam on the probe | Erratic pH and dissolved oxygen values during high-foam phases | Conductivity foam detection with controlled antifoam dosing |
| Seal ageing at the port | Sterility alarms and repeated contamination events | Replace silicone seals each campaign and service retractable housings on schedule |
| Blocked sample line | Online analyzer baseline drift and missing results | Filter the sample line and run a cleaning cycle between measurements |
Selection Checklist for Monitoring-Ready Equipment
Buying monitoring-ready equipment means specifying the interface first: how many ports, where they sit, how each probe is calibrated, and how the data leaves the skid.
- At least two spare 25 mm ports, capped and marked on the P and ID for future analyzers.
- Port positions that stay valid across the full working volume, not only at maximum fill.
- Retractable housings where a probe may need inspection during a long campaign.
- Standard signal types such as 4 to 20 mA, Modbus TCP, or OPC UA for the control and historian layer.
- Cleaning and sterilization procedures that match the temperature and chemistry limits of every installed probe.
- Documented materials and surface finish for wetted parts, typically SUS316L with a defined roughness range.
- A factory acceptance test that includes sensor calibration records, not just mechanical checks.
Processes with tight sterility and documentation demands, such as human milk oligosaccharide production, benefit most from this checklist because every extra port has to be justified in the validation package.
 Custom Bio Fermentation Tank System for Human Milk OligosaccharidesCustom stainless steel fermentation system for human milk oligosaccharides, relevant because sterility documentation and in-line versus at-line sensor choices shape validation and control.View Product →
Frequently Asked Questions About Bioprocess Monitoring
What is the difference between in-line and at-line bioprocess monitoring?
In-line sensors sit in the vessel or in a sterilizable housing and report continuously, so they can drive a control loop directly. At-line analyzers take a sample to an instrument beside the skid and report a discrete result, usually 15 to 45 minutes later. In-line suits temperature, pressure, pH, and dissolved oxygen; at-line suits substrates, metabolites, and product titer.
Which parameters should be monitored in every fermentation run?
Temperature, pH, dissolved oxygen, pressure, agitation speed, and foam are the baseline. Fed-batch and perfusion processes also need a feed-related measurement such as residual glucose or cumulative feed weight, plus off-gas carbon dioxide to track metabolic activity and confirm that the culture is behaving as expected.
How often should pH and dissolved oxygen sensors be calibrated?
Before every sterilization cycle at minimum, using two fresh buffers for pH and a zero and span check for dissolved oxygen. Campaigns that run for several weeks usually add a mid-run verification, because a shift of 0.05 to 0.1 pH units after sterilization is normal, while larger drift indicates a failing reference junction or membrane.
Can monitoring be added to an existing bioreactor?
Partly. At-line analyzers, external flow loops, and soft sensor models can be added without modifying the vessel. Installing new in-line probes usually means welding additional ports, which requires re-qualification of the reactor. Where no free ports exist, at-line chemistry combined with off-gas analysis is the practical route.